Software Capabilities
The Verasonics software suite is at the core of the Vantage and Vantage NXT Ultrasound Research System and provides:
Flexible programming environment using the MATLAB programming model or Acquisition SDK
Open architecture with full access to system parameters for data acquisition, custom imaging, and signal processing
Comprehensive real-time imaging modes supporting B-mode, Doppler, Elastography, Photoacoustic imaging, and more
High-performance data handling with advanced tools for offline analysis and visualization
An interactive help system, integrated into MATLAB Document Editor, that provides quick reference to over 400 structure names, attributes, and keywords to facilitate script development and reduce runtime errors.
Ultrasound Simulator Software
The purchase of every Vantage NXT and Vantage system includes a hardware license to operate the system, as well as five additional Simulator licenses that can be installed on other computers used by lab members.
The Verasonics Simulator software tool enables users to develop and test MATLAB-based programming structures, even without being connected to the acquisition system, allowing multiple users to work in parallel. The Simulator supports visualization of the sequence of events and data acquired from RF to IQ to image data, including 3D images, on any number of channels, even more than are available on the acquisition hardware system.
To learn more, visit our Ultrasound Simulator Software page.
Software Toolboxes
Each Vantage NXT Research Ultrasound System includes a variety of utilities and software tools that support the development and debugging of scripts for sequence programming. These tools complement a library of more than 500 example scripts that demonstrate programming techniques, research applications, and featured functionalities.
Over the years, Verasonics has continued to expand this library of tools and example scripts. Here is a sampling of the most popular tools:
A color map facilitates the perception of subtle variations in tissue texture. Allows users to adjust the gamma curve of the display window and visualize the effect on the image in real-time. Up to five curve plot settings can be saved for different tissue imaging needs.
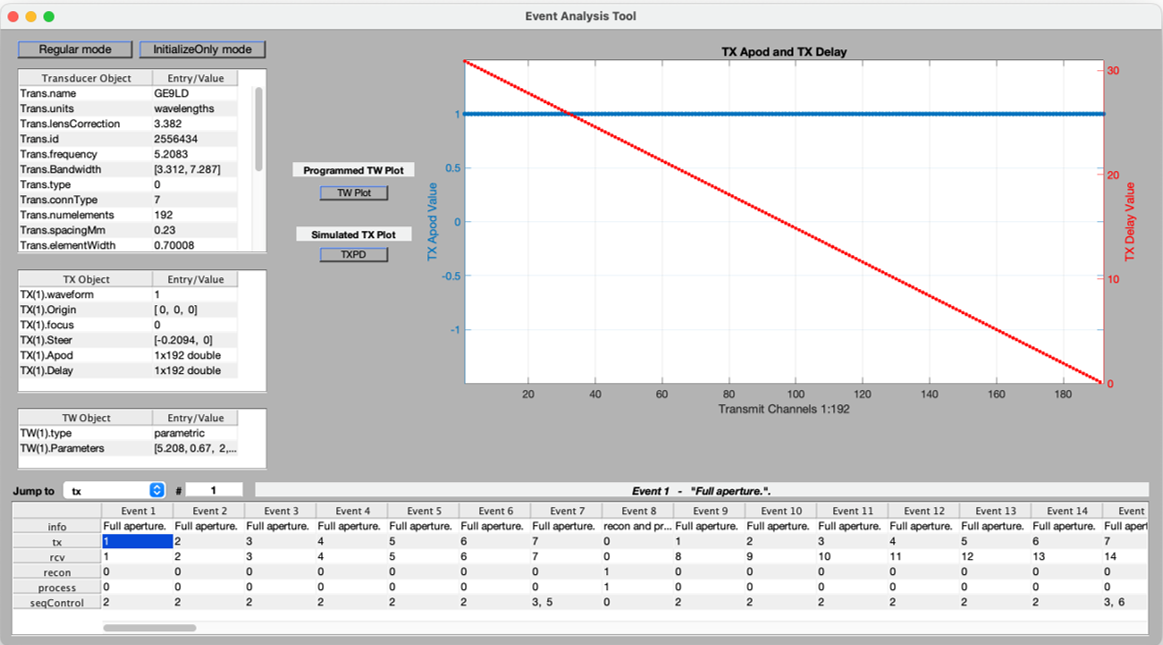
The Event Analysis tool assists with developing and debugging a setup script. Displays all events in a sequence after running a SetUp script and allows users to click any event to inspect its associated structures in MATLAB.
The preSetTool is used to save the configuration of the UI controls, as shown in the VSX Control GUI for most example scripts, PTool, ColorMapTool, filterTool, and some predefined UI controls using VsSlider and VsButtonGroup definition. After optimizing for a particular application, the user can save all UI controls, such as TGC, TGC All Gain, Digital Gain, Range, and Speed of Sound, as a preset for easy reuse without manual adjustment.
The Process Tool, or PTool, supports modification of the image-processing parameters.
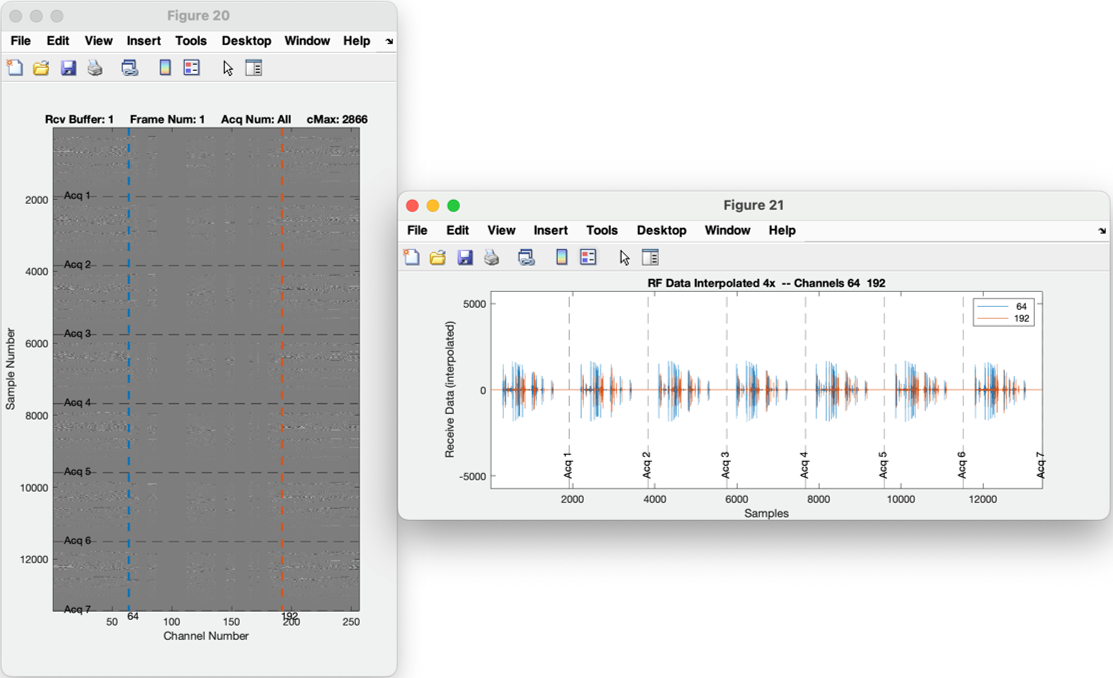
The Save RF tool allows the user to save RF data to a desired location for post-processing.
This tool provides a dedicated environment for advanced elastography research using the L7-4 Linear transducer. This sequence script allows to generate Acoustic Radiation Force (ARF) pushes and tracking shear waves via high-speed plane wave imaging. You have complete visibility and control over the specific code, enabling real-time adjustments to push pulse duration, transmit voltage, and the tracking region of interest. Designed for researchers who need more than standard settings, it allows to reposition the push focus on the fly or integrate your own custom external functions for wave generation.
This tool allows the user to visualize the Trans, Media, and PData structures in a single 3D coordinate system. If no argument is provided, a new figure is created.
Allows developers to easily visualize transducer characteristics for probe integration and testing with the Vantage NXT system.
This tool allows the user to visualize the pixel data or pixel regions that were defined in the setup script, and that will be use during the reconstruction process
When a TX structure is present in the MATLAB workspace, invoking the showTXPD tool produces and displays beam plots of the transmit beam that are produced by each individual TX structure.
Frequently Asked Questions
Learn more about Verasonics’ software architecture and capabilities. This information will assist current and potential users in gaining a broader understanding of the Vantage & Vantage NXT Research Ultrasound Systems.