Welcome to the first issue of Volume 5 of PLANE WAVE, Verasonics’ Newsletter through which we share information about new products and technologies, emerging applications, conferences, training opportunities, and collaborations with researchers in ultrasound and ultrasonic technologies. We hope you find these newsletters informative and interesting, and welcome your suggestions for future topics.
New Products and Applications • Technology Information • Research • Conferences and Training
The Vantage System’s Powerful Suite of Programming Tools
Every Vantage™ Research Ultrasound System comes with a variety of utilities and software tools designed to assist users in developing and debugging their scripts for sequence programming. These are in addition to over 500 example scripts that demonstrate programming techniques for the Vantage system, including many research applications and featured functionalities. Over the years, Verasonics has continued to expand this library of tools (Figure 1) and example scripts with the intent to help customers maximize the use of their Vantage systems. This Plane Wave issue provides an overview of these utilities and tools included in the latest Vantage software releases. A future issue of Plane Wave will provide information about other Vantage software features..
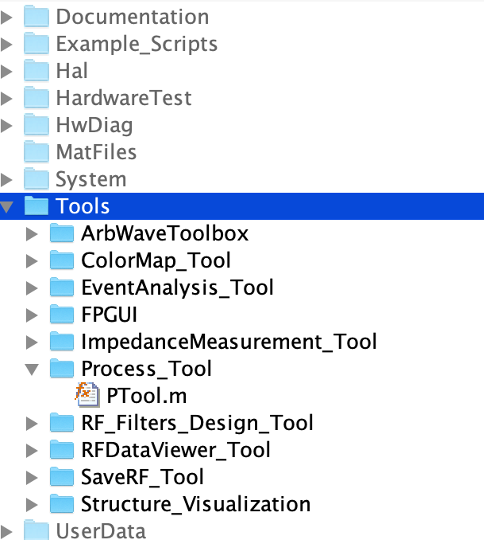
Figure 1: Directories of tools and example scripts found in a customer’s download folder.
User Tools
Under the root path of Vantage software releases, there is a “Tools” folder containing the tools for Vantage users. These tools may be categorized into three groups: user programming tools, script debugging tools, and data processing tools. Below is an overview of their intended use. Please refer to the AppNote Tools Summary.pdf located in the documentation folder for detailed instructions.
User Programming Tools
The user programming tools are intended to help users develop certain advanced sequence programming parameters, including hardware filter coefficients and tri-state pulse codes for arbitrary waveform transmission.
The RF_FilterDesignTool (Figure 2) depicts the response of the two independent, user-programmable RF data digital filters available on the Vantage hardware. Users can adjust, redesign or disable the filters using the provided GUI and see the response and effect on data acquisition in real-time. When the tool is used offline, the generated coefficients should be copied and pasted into the user setup script.
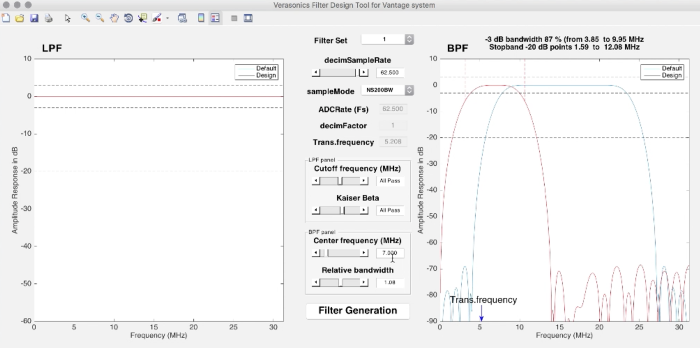
Figure 2: RF_FilterDesignTool GUI
The ArbWaveToolbox (Figure 3) has a collection of utilities and examples to help users utilize arbitrary waveform transmissions using the Vantage system based on a proprietary pulse width modulation technique. When users input the desired transmit waveforms and their transducer impulse response, the tool will output the appropriate tri-state pulse codes required by the sequence programming user setup script. Note that there are two levels of Arbitrary waveform encoding available: the GUI-based version and the command-line version. The Command Line Arbitrary Waveform Encoders (CLAWE) tool provides more flexibility and accuracy at the expense of longer computation times.
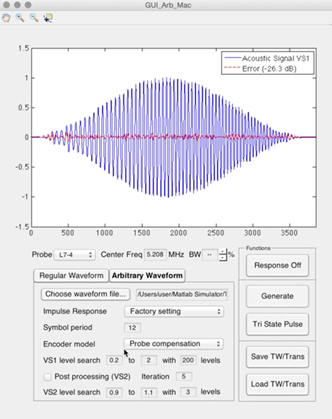
Figure 3: ArbWaveToolbox GUI
Script Debugging Tools
The script debugging tools aim to simplify the user setup script programming or debugging process by providing a visual display of the sequence programming structures and their interconnected relationships.
The EventAnalysis_Tool provides users with a visual display of all the sequence events included in the user setup script. Clicking on a specific event prompts the tool to display all other structures associated with that event, making it convenient for a user to find indexing errors that would otherwise be difficult to identify without seeing the entire indexing/referencing logic. Furthermore, the tool estimates data transfer times that are helpful in determining the maximum frame rate achievable.
ShowGeometry_Tools (Figure 4) are a set of utilities that when called, provide a graphical representation of the Verasonics coordinate system, transducer geometry, imaging area as well as the scatterers positions specified for the simulation. Visualizing these structures in a single 3D figure helps users to understand the configuration of the entire imaging system. The subfolder contains utility functions including showGeometry, showTrans and showPData.
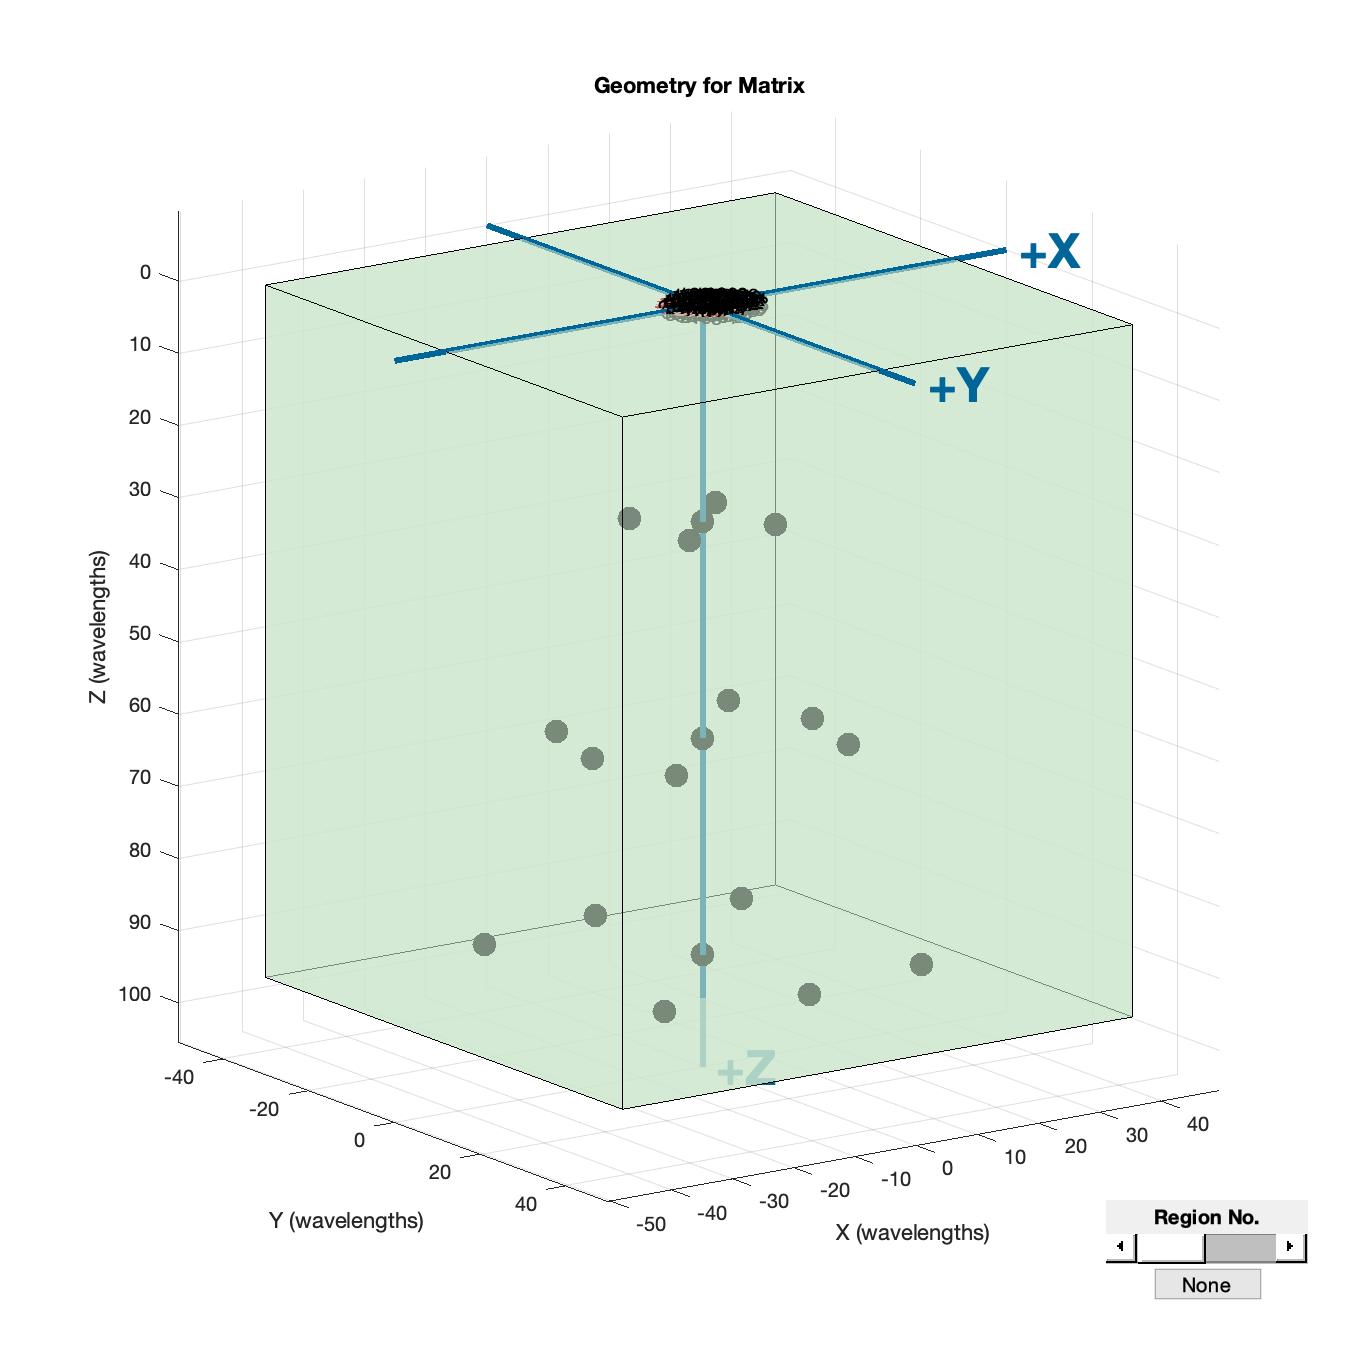
Figure 4: ShowGeometry_Tools
ElementToChannelMapping returns the mapping patterns amongst transducer element numbers, transducer adapter pin numbers and the system channel numbers. The mappings are useful when one attempts to use a transducer that is connected to the system not strictly following the 1-to-1 mapping relationship. In that case, the element-to-channel mapping displayed by this tool will help the user to unscramble the acquired RF data from the system channel order to the transducer element order for correct data processing.
The showHardwareMemoryUsage tool is a function displaying the actual memory usage in the Vantage hardware system. After running a hardware sequence, this function reports the per-channel memory usage for the transmit and receive descriptors, RF data buffering, spaces available for the DMA controller, as well as the sequence memory usage for the event sequence instructions and TGC waveforms. If a multiplexed transducer or transducer adapter is used, it will also report the memory usage for the multiplexer programming. The actual memory usage returned will help users to work around the out-of-memory type of scripting errors by conscientiously reallocating the memory usage.
Data Processing Tools
The data processing tools are provided to meet the common data processing needs of ultrasound researchers.
The Process_Tools can be called during system runtime from the GUI to adjust basic ultrasound image processing parameters such as the compression factor, digital gains, level of speckle reduction, grain removal and persistence, etc.
The ColorMap_Tool allows users to adjust the display gamma curve to better visualize the subtle differences in tissue structures. When the curves are optimized, the user can save up to 5 gamma curve presets and load them in future scans.
The PreSetTool is used to save or load other UI control presets via the Vantage system GUI. These UI controls could be the Vantage default ones, such as the frequently adjusted TGCs and voltage controls, or the user-added ones. Once saved for a particular application, they can get reloaded when the same application is run in the future.
The RFDataViewer_Tool (Figure 5) is a stand-alone utility to visualize the RF data in the RcvData buffer using a grayscale image and line plots. The grayscale image, by default, plots all system channels’ RF samples of an entire frame and marks the boundaries between acquisition events in the frame. The line plots show the same information but only from two user-selected channels. Users can use the figure’s rubber-band-box zoom control to examine data details for a smaller region within a frame.
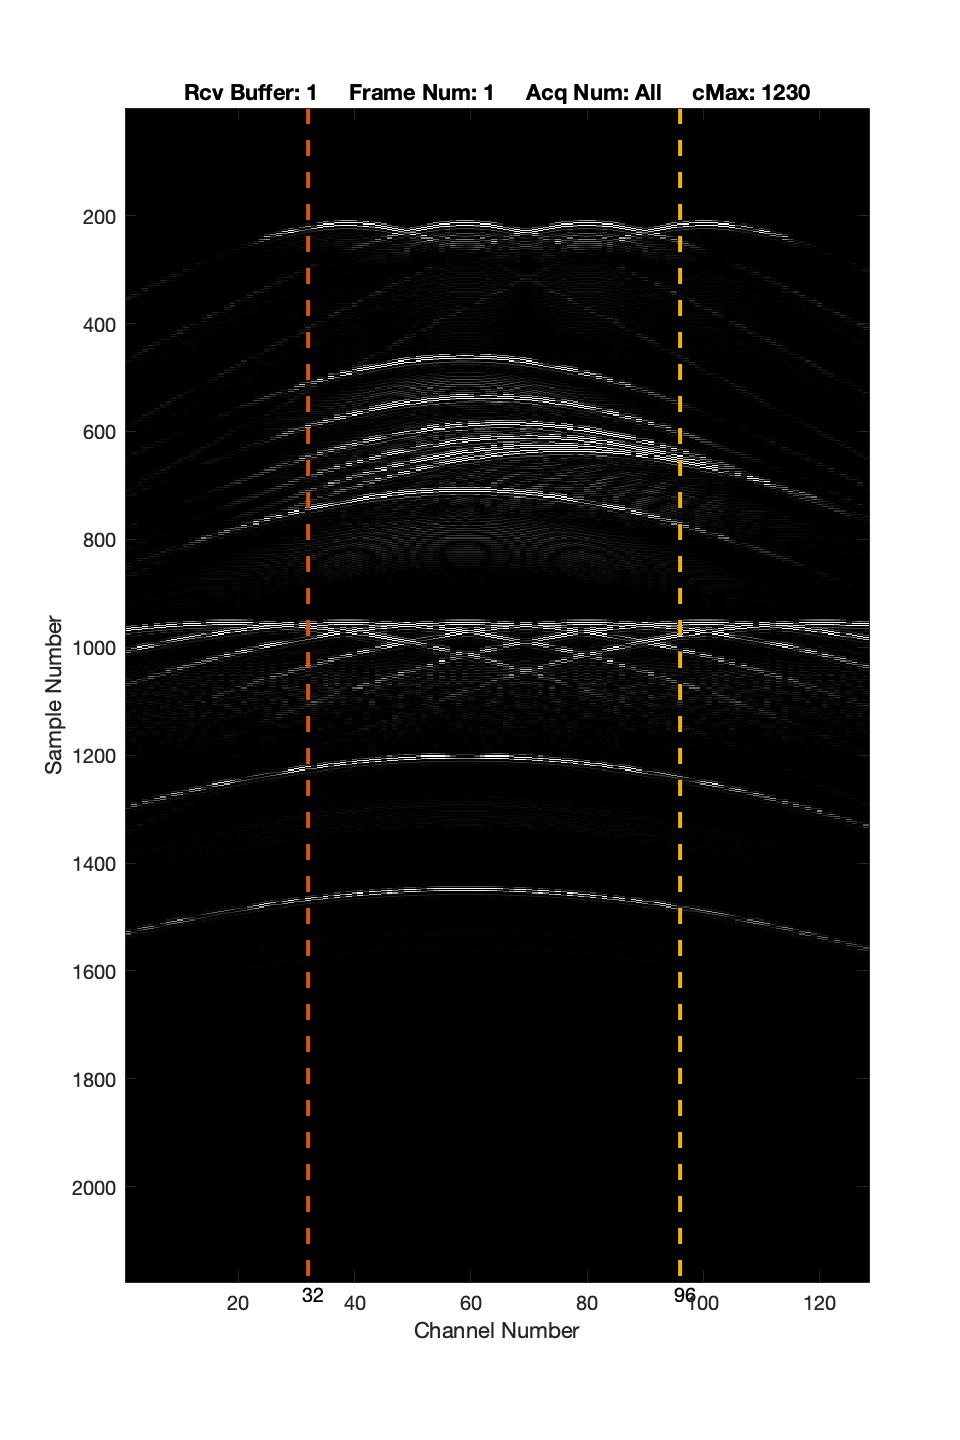
Figure 5: RFData_ViewerTool

